This has been a rough year for the stock market and bonds. The importance of asset allocation is never as apparent as when the most popular asset classes perform poorly, and the average investor wonders how to dampen the decline. Constructing portfolios with less downside capture is critical to building long-term wealth.
In this article, we will explain the theory behind creating less risky portfolios and how it helps protect your clients’ wealth.
So how do you construct a portfolio? As advisors, you know that you want to mix and match asset classes in ways so risk is minimized for a given level of return. The technical term for that is “efficiency.” Advisors and investors need to begin with a clear definition of “asset class” and understand some important mathematical concepts used to identify their characteristics. In subsequent articles, we will show you how to use this information to build a portfolio, why the 60/40 portfolio is no longer a good choice, and finally, we will provide you with some low-cost, do-it-yourself portfolios that include index funds and ETFs.
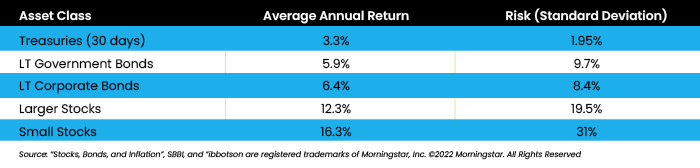
Modern Portfolio Theory, a Nobel Prize-winning method used to create portfolios, is essential to understand. MPT aims to reduce risk, not necessarily increase return. It is difficult for a diversified portfolio to match or exceed the return of the asset class with the highest historical return, which in most cases are small stocks. Figure 1 shows the historical returns (and risk levels) for some standard asset classes.
Small stocks are one of the best-performing assets over time, but they are high risk. Having just that asset class in a portfolio would only work if a client has many years before they need to access their funds and can stomach the rollercoaster ride. We’ll talk more about risk and how it is measured later.
Asset-class confusion
Let’s take a step back and define an asset class. The discipline of investment science requires us to define our asset class selection criteria before adding asset classes. Unfortunately, significant confusion exists in the definition of “asset class.”
Asset classes should have the following main distinguishing characteristics:
Assets within an asset class should have relatively similar attributes (i.e., be homogenous).
Asset classes should be mutually exclusive: Their risk vs. return profile and price movements over time should not be similar.
Asset classes should enhance diversification: If we add an investment to a portfolio that does not improve its risk vs. return parameters, it is not part of a separate asset class.
Their sources of risk should be different. For example, one asset class might be more impacted by inflation, another by the international economy, and another by a host of natural disasters. It is essential to recognize that we can only achieve higher returns when we take on risk, but the key here is to spread the types of risk around, so they offset each other and do not appear simultaneously.
They should be readily investable, and investing in them should be possible in a cost-effective manner.
They should not require selection skills, meaning you invest in the asset class and do not have to depend on an active manager to fully capture the risk vs. return profile for the asset class.
Characteristic number 6 is the one that trips up many investors and even professionals; selection skill is something that is not readily repeatable. We have seen that time and time again if some sort of skill is necessary to capture the unique characteristics of an investment category then you cannot depend on those characteristics being dependable enough to rely on, or repeatable.
Various measures help us determine the role of adding the asset class to the portfolio. Every asset class has a different strength allowing it to play a specific role in the overall portfolio strategy. For instance, some investments may provide regular income while others may serve as a temporary place to hold cash. Some have multiple purposes and can fill more than one role.
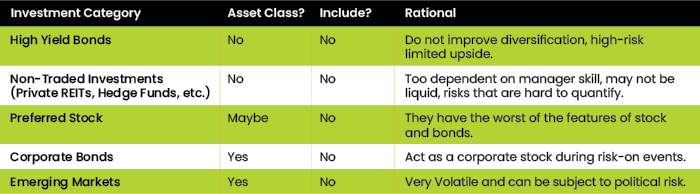
Some investments that many advisors and individuals use are not asset classes and in our view, do not belong in anyone’s portfolio. Figure 2 has a mix of non-asset types and investment categories that we suggest investors avoid.
Figure 2
Asset Classes Our Firm Avoids
In particular, we suggest you avoid two broad categories of investments: those that are not asset classes and those that do not improve portfolio “efficiency” or have types of risk that cannot be quantified.
In that category, we recommend avoiding illiquid investments that are not particularly diversified, for example, private REITs. Portfolio efficiency comes directly from the mathematical theory associated with Modern Portfolio Theory. MPT was the first-ever attempt to apply a formal mathematical approach to designing portfolios. The key innovation is the use of mathematics to describe risk and, even more important, to model the way assets behave in relation to each other. Risk is measured mathematically through the standard deviation, how much an investment’s return can vary from its long-run average year to year.
In Figure 1, the standard deviation for large-cap stocks is over 19%, leading to a 98% probability that the investment return for large stocks can be as high as the average annual return, plus or minus two times the standard deviation. Therefore, the return range is +51% to -27% in any given year.
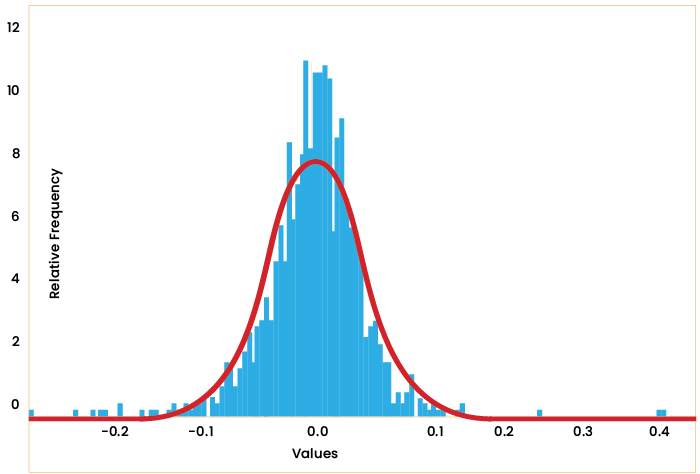
The weakness with this measure of risk is the frequency of “outliers,” supposedly low-probability negative and positive returns that happen more frequently than indicated. These “tail” events seem to occur with a frequency that defies the frequency indicated by the standard deviation. In some cases, circumstances that should only happen once every 300 years arise every 20 years! Mathematics does not fully capture the risk of investing. So, there are problems with this method: Bad events occur more frequently than expected, and the treatment of negative returns is the same for positive returns. As investors, we like positive surprises but dread negative ones. What follows is a comparison of the S&P 500 index actual returns (in blue) over the years vs. what is expected according to MPT (in red).
Figure 3
S&P Returns vs. MPT Predictions Source: Atlas Fiduciary Financial
Figure 3 shows the number of times a certain monthly return for the S&P 500 occurred beginning in 1926 and running through 2020. Since that index has averaged 1% return per over that time the peak of the chart is close to that number. This chart also indicates how likely a certain return is to occur in a month. If the index returns were really distributed “normally” as indicated by the red line, the large negative monthly returns should have been extremely unlikely — yet there they are.
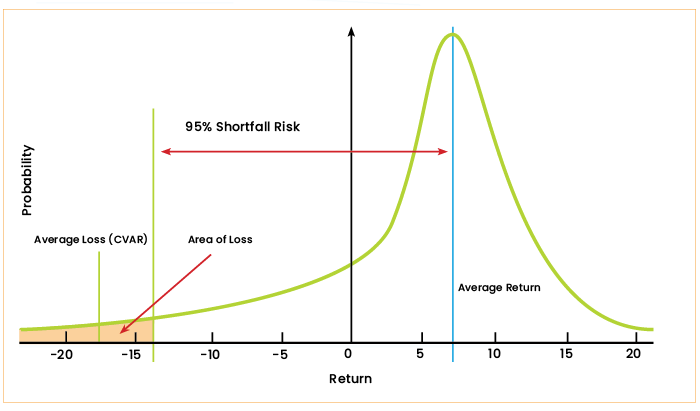
These problems can be mostly eliminated if we use a different measure of risk called Conditional Value at Risk (CVaR). This measure only considers downside surprises and helps quantify tail risk by averaging the negative returns beyond a chosen threshold. For example, that threshold might be the worst 5% or 10% of potential returns beyond the expected standard deviation. Minimizing CVaR helps us create portfolios with less risk of significant declines in value, results that are more sensitive to how we respond as investors.
In Figure 4 as an example, we plot the average annual return for a hypothetical portfolio (horizontal line) against the frequency of its occurrence (vertical line). Using CVaR, we try to find portfolios that have a low likelihood of exceeding some threshold negative return with a certain likelihood — in this case, 5 out of 100 or 5%. We seek to minimize the decline in the portfolio in those worst 5% of annual returns. That is how CVaR is defined.
Figure 4
A Look at CVaR Source: Atlas Fiduciary Financial
The importance of reducing risk
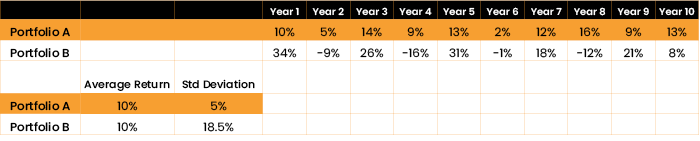
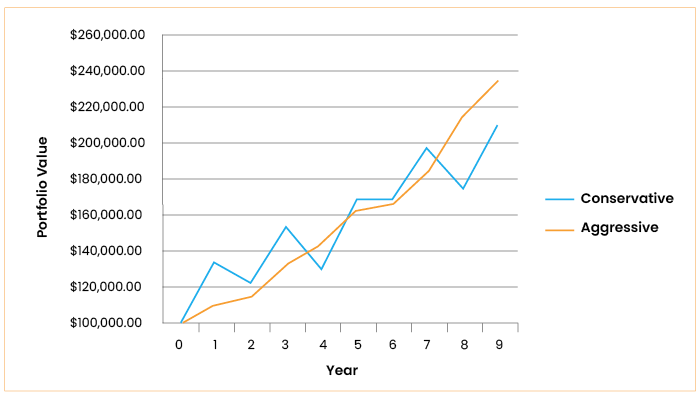
Reducing risk leads to more wealth. The more volatile a portfolio, with more significant declines, the more difficult it is to recover from the fall. Figure 5 shows two portfolios, one with less risk and a lower standard deviation and one with more risk and higher volatility. These are two hypothetical portfolios with the same average return. The chart shows the difference in wealth a client will have over time if one portfolio is much more volatile than the other. Despite having the same average return, the aggressive portfolio is much more volatile, with four times the risk of the conservative one.
Figure 5
Figure 6
Building Wealth Source: Atlas Fiduciary Financial
Though both portfolios have the same average return, the more conservative portfolio’s wealth is over 10% higher than the more volatile one. This difference in wealth widens the longer you are invested in these portfolios.
Correlation – measuring the interrelationship
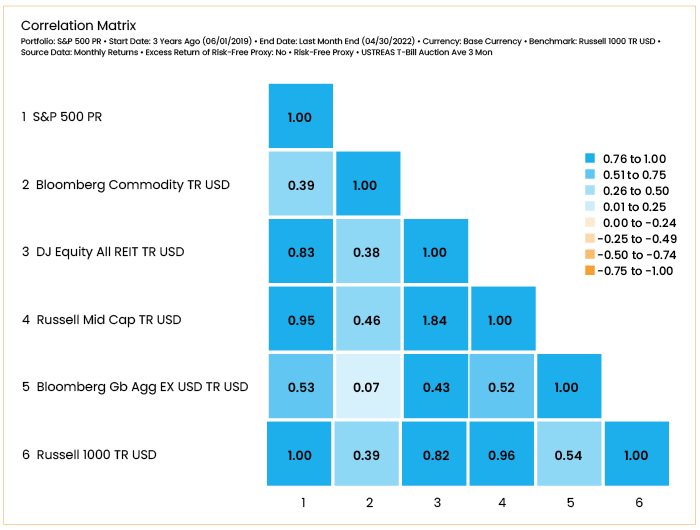
Correlation captures how the performance of various asset classes varies in relation to each other. A correlation of 1 means perfect alignment, and a correlation of -1 means their prices (and returns) move opposite. Combining investments with a correlation of less than one in a portfolio leads to portfolios with less risk than their components (that effect is one of the key points behind MPT). Correlations are commonly displayed as a “matrix.”
Figure 7
Sample 3-Year Correlation Matrix with Standard Asset Classes Source: Morningstar
You read that by choosing a row and column. For example, in Figure 7 the correlation of the Bloomberg commodities index with the Russell 1000 is 0.39, and the diagonal shows the correlations of asset classes (indices) with themselves, which is always 1. The low correlation of commodities with the Russell 1000 indicates that a combination of these in a portfolio will have less risk than a portfolio that consists of just the Russell 1000.
While represented as a single number, correlations are not stable; they can rise or fall over different periods. For example, the one-year correlation of commodities and the Russell 1000 is -.20, indicating the significant value of commodities to a portfolio over the last year. The instability of correlation factors has led some to use much more complex mathematical representations for correlation. Unlike most advisors, we use that advanced method to develop efficient portfolios. The next article in this series will provide some do-it-yourself models designed using more advanced approaches.
Choosing Investments that are Style Pure
Once we decide how to allocate a portfolio among various asset classes using the mathematics of MPT and indices for each one, we need to find vehicles that most closely match the index’s performance representing the asset class; in other words, they should be style “pure.” Too often, we have seen advisors and individuals create portfolios that include holdings that are not style pure; in many cases, their apparent outperformance compared to their chosen “benchmark” is because they have included investments that are not in the asset class they are supposedly part of.
An example that readily comes to mind is many funds and ETFs that claim to be invested in commodities. Commodities are a unique and, in our opinion, important asset class (as this was written, it was one of the few asset classes in positive territory in 2022). Many of the so-called commodities funds hold stock in companies in the energy or mining industry. Those funds will be much more correlated to the stock market than a proper commodities fund that genuinely invests in commodities futures. Having that higher correlation with the stock market defeats the purpose. By using a service like Morningstar or by researching a fund or ETF online, in most cases you can see their actual holdings and determine if they are who they say they are.
In the next article, we will show you how diversification works, why the 60/40 portfolio may not be the best choice for the next few years, and provide you with a do-it-yourself portfolio using readily available investments.
Stephen Craffen BE, MBA, MS, ChFC, CLU, CFP®, CFA is a partner at Atlas Fiduciary Financial LLC. He is the portfolio manager for the firm and is a former national chair of NAPFA. Atlas Fiduciary also has a youtube channel, “It’s Your Smarter Money.”


 Source: Atlas Fiduciary Financial