As record highs reached by major benchmarks, breadth has weakened.
Benchmark records are not confirmed by most markets, sectors and stocks.
Thrust signal from 30-day new high indicator would require substantial breadth improvement.
While there’s been no shortage of headlines about the latest record highs on the S&P 500 and NASDAQ, the highs have been less significant as a sign of market strength than as an influence on investor sentiment. The Big Mo Tape Composite, Global Big Mo and other broad market barometers reflect trend conditions that are no better than neutral, as summarized by the Fab Five Tape Component.
Yet excessive optimism has been indicated by the Daily Trading Sentiment Composite and other sentiment indicators that have been keeping the Fab Five Sentiment Component on a bearish reading.
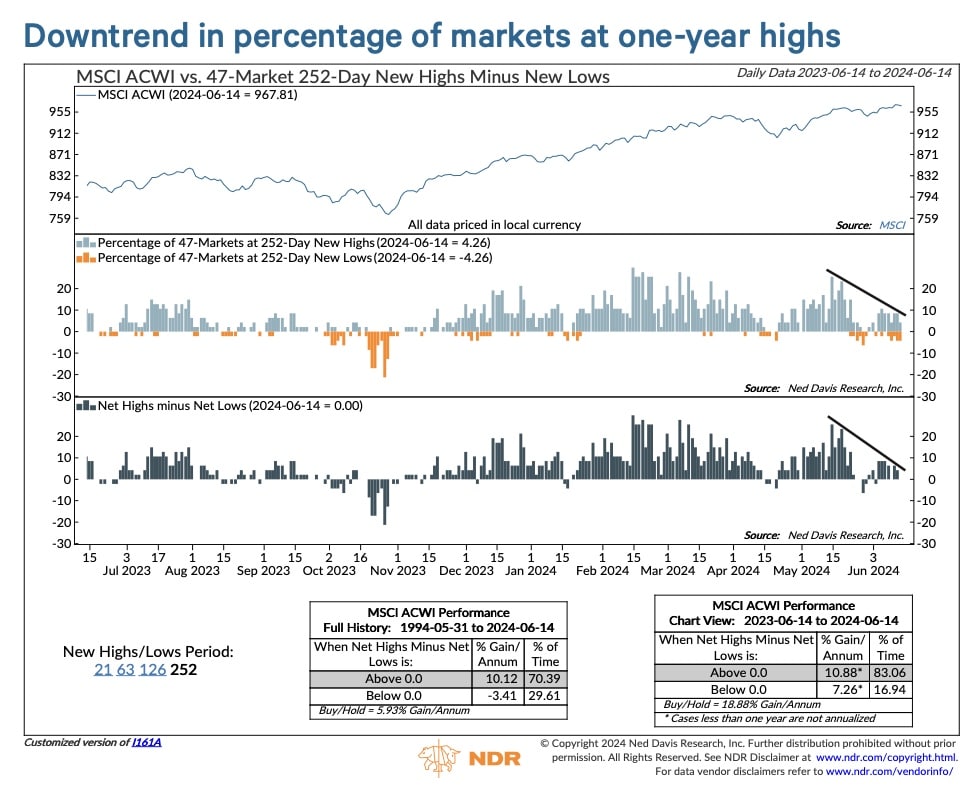
Our New High Proximity report indicates that among the 47 ACWI component markets, the U.S. has been joined by just four others in reaching record highs this month, five others at four-year highs, and eight others at one-year highs.
Indicating a divergence from the All Country World Index, in which the ACWI carries 63% of the weight, the chart below shows downtrends in the percentage of markets at one-year highs (middle clip) and its spread with the percentage of markets at one-year lows (bottom clip).
With net new highs still positive, the indicator is still casting a favorable vote in our Rally Watch report. But it is only one of four indicators that are still doing so in the 16-indicator report. Like the net new highs indicator and other gauges of market breadth, the report’s aggregate reading has been diverging from the records reached by the S&P 500, NASDAQ and ACWI.
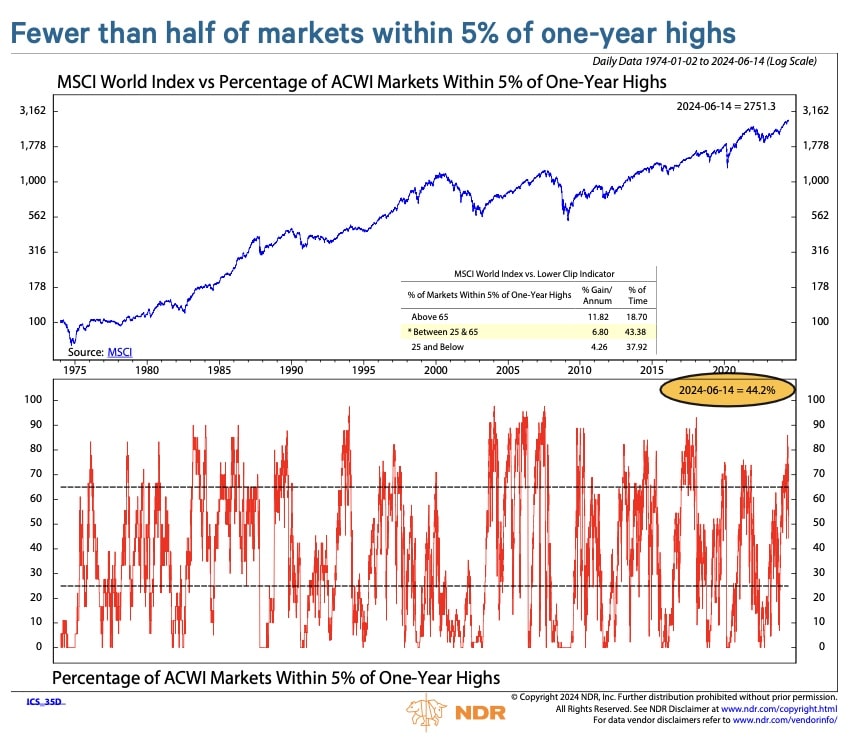
For many markets, a return to new highs would require substantial rallying. Fewer than half of the markets are within 5% of one-year highs (seen below), 26% are within 5% of four-year highs and 23% are within 5% of record highs, down from a high of 36% last month.
The New High Proximity report also indicates that among the 11 ACWI sectors, only three have reached one-year highs this month — Communication Services, Health Care and Information Technology. And the latter two are the only ones that have reached four-year highs and record highs.
Diverging new highs can also be seen at the stock level. Among close to 1500 stocks in the MSCI World Index, only 17% are within 5% of record highs.
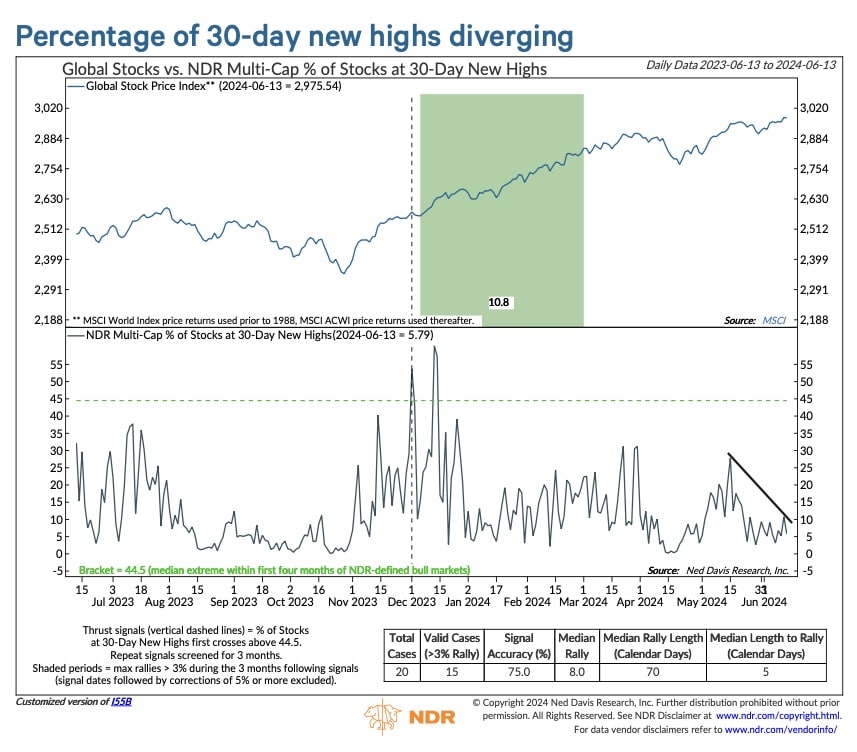
Even a 30-day new high has been a challenge to reach, as indicated by the percentage of stocks in our U.S. multi-cap universe at 30-day new highs. Another divergence from the benchmark highs, the percentage has gotten only as high as 11% this month and has since receded, as shown below.
One of the short-term components of the Rally Watch, the indicator will generate a breadth thrust signal by rising above 44.5%, which would be a sign that the market uptrend has regained its vigor. But like other indicators showing divergent new highs, there’s currently little to suggest that the breadth of new highs will be confirming the benchmark highs any time soon.
See the signals™
Founded in 1980, Ned Davis Research Group is a leading independent research firm with clients around the globe. With a range of products and services utilizing a 360° methodology, we deliver award-winning solutions to the world’s leading investment management companies. Our clients include professionals from global investment firms, banks, insurance companies, mutual funds, hedge funds, pension and endowment funds, and registered investment advisors.
Important Information and Disclaimers
NDR (Ned Davis Research) uses the weight of the evidence and a 360-degree approach to build up to market insights. When we say “evidence,” we mean processing millions of data series to fuel a historical perspective, build proprietary indicators and models, and calm investors in a world full of bull/bear news hype and hysteria. We believe that no client is too big or too small to benefit from NDR’s insights.
The data and analysis contained in NDR’s publications are provided “as is” and without warranty of any kind, either expressed or implied. The information is based on data believed to be reliable, but it is not guaranteed. NDR DISCLAIMS ANY AND ALL EXPRESS OR IMPLIED WARRANTIES, INCLUDING, BUT NOT LIMITED TO, ANY WARRANTIES OF MERCHANTABILITY, SUITABILITY OR FITNESS FOR A PARTICULAR PURPOSE OR USE.
NDR’s reports reflect opinions of our analysts as of the date of each report, and they will not necessarily be updated as views or information change. All opinions expressed therein are subject to change without notice, and you should always obtain current information and perform due diligence before trading. NDR or its affiliated companies or their respective shareholders, directors, officers and/or employees, may have long or short positions in the securities discussed in NDR’s publications and may purchase or sell such securities without notice.
NDR uses and has historically used various methods to evaluate investments which may, at times, produce contradictory recommendations with respect to the same securities. When evaluating the results of prior NDR recommendations or NDR performance rankings, one should also consider that NDR may modify the methods it uses to evaluate investment opportunities from time to time, that model results do not impute or show the compounded adverse effect of transaction costs or management fees or reflect actual investment results, that other less successful recommendations made by NDR are not included with these model performance reports, that some model results do not reflect actual historical recommendations, and that investment models are necessarily constructed with the benefit of hindsight. Unless specifically noted on a chart, report, or other device, all performance measures are purely hypothetical, and are the results of back-tested methodologies using data and analysis over time periods that pre-dated the creation of the analysis and do not reflect tax consequences, execution, commissions, and other trading costs. For these and for many other reasons, the performance of NDR’s past recommendations and model results are not a guarantee of future results.
Using any graph, chart, formula, model, or other device to assist in deciding which securities to trade or when to trade them presents many difficulties and their effectiveness has significant limitations, including that prior patterns may not repeat themselves continuously or on any particular occasion. In addition, market participants using such devices can impact the market in a way that changes the effectiveness of such devices. NDR believes no individual graph, chart, formula, model, or other device should be used as the sole basis for any investment decision and suggests that all market participants consider differing viewpoints and use a weight of the evidence approach that fits their investment needs. Any particular piece of content or commentary may or may not be representative of the NDR House View, and may not align with any of the other content or commentary that is provided in the service. Performance measures on any chart or report are not intended to represent the performance of an investment account or portfolio, as some formulas or models may have superior or inferior results over differing time periods based upon macro-economic or investment market regimes. NDR generally provides a full history of a formula or model’s hypothetical performance, which often reflects an “all in” investment of the represented market or security during “buy”, “bullish”, or similar recommendations. This approach is not indicative of the intended usage of the recommendation in a client’s portfolio, and for this reason NDR does not typically display returns as would be commonly stated when reporting portfolio performance. Clients seeking the usage of any NDR content in a simulated portfolio back-test should contact their account representative to discuss testing that NDR can perform using the client’s specific risk tolerances, fees, and other constraints.
NDR’s reports are not intended to be the primary basis for investment decisions and are not designed to meet the particular investment needs of any investor. The reports do not address the suitability of any particular investment for any particular investor. The reports do not address the tax consequences of securities, investments, or strategies, and investors should consult their tax advisors before making investment decisions. Investors should seek professional advice before making investment decisions. The reports are not an offer or the solicitation of an offer to buy or to sell a security.
Further distribution prohibited without prior permission. Full terms of service, including copyrights, terms of use, and disclaimers are available at https://www.ndr.com/web/ndr/terms-of-service.
Copyright 2024 (c) Ned Davis Research, Inc. All rights reserved.