
Although the “Magnificent Seven” mega-cap tech companies have recently attracted most of the attention, we think high-quality small-caps have quietly become positioned for better long-term rewards in the stock market.
In this Market Scout, we want to build on what we communicated a few months ago. Back then, we described how the so-called Magnificent Seven mega-cap tech stocks—powered by enthusiasm surrounding artificial intelligence (AI)—led the market higher in 2023. We also provided two charts showing why high-quality names, and small-caps in particular, could be ready to take the baton and outperform the broader market over the next several years.
Wasatch History in Review
Although some of what we cover below pertains to today’s macro environment and our thoughts regarding the relative attractiveness of small-caps, it’s important to note that macro conditions don’t play major roles in our investment process. Instead, at all times, our process is mainly focused on company fundamentals. To understand why, it’s helpful to review a bit of Wasatch history.
When our mentor, Dr. Sam Stewart, founded Wasatch Global Investors in the 1970s, he was looking for ways to defy the concept that markets price stocks “efficiently.” To be sure, Sam and his early partners were attracted to small-caps. But the reason wasn’t due to a preconceived notion that small-caps make better investments.
In practice, Sam and his partners gravitated toward small-caps based on three main dynamics that became apparent through bottom-up research. First, there are simply more names (more opportunities) in the small-cap space, and investors only need to find a relative handful of “gems” among the “rocks.” Second, small companies tend to have greater headroom for long-duration growth because they can double in size over and over, and still be relatively early in their development. Third, small companies are apt to have business drivers that are less obscured by factors beyond management’s control—so research analysts willing to do the work can gain an edge compared to investing in larger companies.
A major challenge regarding investing in the small-cap space, however, is that more “landmines” surround the mispriced gems. That’s why we undertake extensive due diligence, which includes visiting companies, looking at the track records of key personnel, and speaking with competitors and suppliers. Even today, the managers at our companies sometimes remark that the level of scrutiny we perform is very uncommon.
Another challenge is that tolerating the volatility inherent in even the highest-quality small-caps takes fortitude. As a matter of fact, the stock prices of some of our best long-term investments have spent a greater number of days underperforming the benchmark than outperforming.
Furthermore, company size constrains how much money we can manage effectively in small-caps. As a result, Wasatch has always been willing to close strategies before a growing asset base would cause us to invest outside of our desired companies or our targeted market-cap ranges.
Small Caps vs. Mega Caps
While we aren’t willing to exceed the capitalization constraints of our small-cap strategies, we nevertheless find it helpful to understand what’s occurring among mid-, large- and mega-cap companies. In this regard, consider the Magnificent Seven—which are Alphabet (the parent company of Google), Amazon, Apple, Meta Platforms (formerly named Facebook), Microsoft, Nvidia and Tesla.
The combined market capitalization of the Magnificent Seven was $13.59 trillion as of March 31, 2024. Moreover, the top two in this group—Apple and Microsoft—were at $2.65 trillion and $3.13 trillion, respectively. By comparison, the combined market capitalization of all 2,000 companies in the Russell 2000 Index was $3.26 trillion.
Roughly speaking, the Russell 2000 is our hunting ground for finding small-cap investments. Put another way, we have approximately 2,000 companies to choose from—all of which combined are about equal to the market capitalization of just one mega-cap tech company.
If we look at the Magnificent Seven and the Russell 2000 companies together, the total market capitalization was $16.84 trillion as of March 31, 2024. That compares to $6.54 trillion as of March 31, 2019, just five years earlier. Moreover, the Russell 2000 companies represent only 19% of the market capitalization, down from 38% five years earlier. The pie charts below depict these numbers in proper proportions.
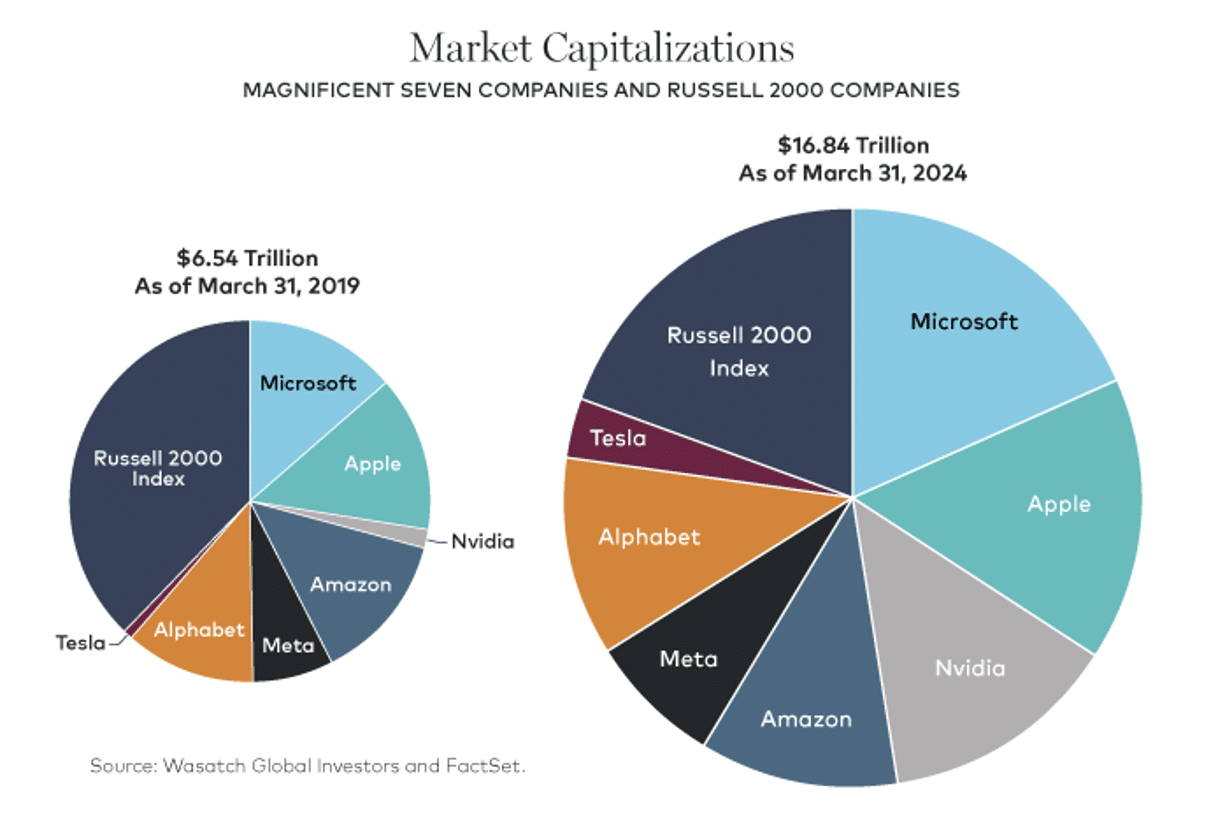 The main takeaway here is that the total market capitalization more than doubled over the past five years, and the percentage in Russell 2000 companies fell by about half. Certainly, market capitalization alone tells us little about an underlying company. After all, tremendous market-share and revenue growth can justify an enormous capitalization size. Additionally, there’s no doubt that the Magnificent Seven are, well, quite magnificent. They have significant competitive advantages, high barriers to entry and massive economies of scale. But extremely large companies, by their very nature, must eventually enter a period in which their growth rates decline.
“Button-Mashing” Revisited
Beyond the potential headwind of slower growth in the Magnificent Seven, we think this group has recently been subject to some level of “button-mashing” among investors. As you may recall from a previous Market Scout, button-mashing is a video-game reference that describes a player frantically pressing buttons in an effort to catch up with an opponent.
Investors who felt they had failed to jump on the AI bandwagon early enough may have been button-mashing the Magnificent Seven in an attempt to generate attractive returns. Of course, button-mashing—aside from an occasional random win—is a bad tactic in video games. And we believe it’s an even worse tactic in investing.
That said, button-mashing hasn’t been confined to mega-caps. In fact, we think there’s been some button-mashing in a few Russell 2000 companies. Still, as described above, there are many more small-caps than large-caps to choose from. And small-caps have greater potential headroom for growth. Other factors possibly favoring small-caps—including market cycles, earnings, valuations and index performance—are described in our Q&A titled Is It Time for a Changing of the Guard?
A Full Market Cycle
There are times when macro forces become so extreme in one direction that it feels as though we could invest simply based on sentiment inevitably reversing. While that’s not how we ever invest, it is how it can feel. But those times are very rare. In the past five years, there were two such macro extremes—which were remarkably close together. Historically, a macro extreme might have occurred only once in a decade or so.
Near the beginning of the Covid-19 pandemic in 2020, the Russell 2000 Growth Index (one of our benchmarks) fell -40.43% from peak to trough in just 20 trading days. At the time, such a big decline didn’t feel justified because stock ownership isn’t merely a claim on current earnings and assets—but also a claim on all future earnings and assets, which we thought were likely to be only marginally impacted by the pandemic.
Similarly, in the 2022 calendar year, the Russell 2000 Growth Index dropped -26.36% and several of the Wasatch strategies performed even worse. Again, this didn’t feel justified because some of the stocks that declined the most were those of companies with especially strong fundamentals (e.g., growing revenues by over 15% and beating Wall Street analysts’ earnings estimates).
So, are we again at such a macro extreme today? We don’t think so. It’s true that we’ve been seeing button-mashing, thematic and algorithmic trading, a rush into private equity and private credit, record flows into passive index funds and other momentum trends. But these trends aren’t enough to make us feel like sentiment will immediately go the other way. In other words, when we say we believe small-caps could be ready to take the baton from mega-caps, we’re referring to what may occur as investor preferences and eagerness change over a full market cycle.
In the shorter term, however, there’s been an interesting development that we’re taking into consideration even though our main focus is on the long term. Recently, positive and negative reports regarding revenues and earnings have been having bigger and quicker impacts on stock prices. This development has heightened our senses from the perspective of risk management, which is discussed in greater detail below.
Opportunities Always Exist Among Small-Caps
We’ve quantitatively analyzed decades of history in our small-cap universe, the Russell 2000 Index, to see what makes a successful company and what makes a successful stock. One of our broad findings is that opportunities always exist.
More specifically, there are always companies that are able to generate five-year annual revenue growth of at least 20%. Additionally, their stocks have massively outperformed the Index for those same five years and the outperformance has occurred—regardless of the priciness of the stocks—in almost all market environments irrespective of inflation, interest rates, economic expansion, recession, momentum, investment style, etc.
In managing our small-cap strategies, we generally want to own companies that can about double their revenues and earnings in five years—and then double them again in the next five years. Although we’re willing to “pay up” for high-quality growth, we specifically avoid a “growth at any price” mentality. We pick through our enormous universe, one company at a time, to find small-caps that meet our criteria. And we think we can buy them at rational prices. This is what we’re doing today. And if we do this consistently, investment performance should take care of itself over the long term.
As we’ve done for decades, we’re currently looking for high-quality companies with great management teams, exceptional business models, sustainable competitive advantages, headroom for expansion, significant returns on capital, low debt levels and healthy cash flows that can be used to self-fund growth. Barriers to entry in a market niche and economies of scale are also attractive. We believe that with an appropriate mix of such companies—and with diversification across sectors and factors like economic cyclicality and interest-rate sensitivity—our strategies can weather a variety of market scenarios.
Management Ranking System Inspired By The Jelly Bean Experiment And The Wisdom Of Crowds
The quantitative analysis described above is based on the Russell 2000 small-cap universe. But we also quantitatively analyze our own specific holdings. What we’ve found is that our top predictor of future investment performance is our management ranking system. In the system, we give each of our companies a management ranking, which is subjective (qualitative). However, our analysis of those rankings is objective (quantitative).
Our management ranking system was inspired by the often-repeated jelly bean experiment. In the experiment, quantitatively oriented finance students are asked to estimate the number of jelly beans in a jar. The usual result is that the average estimate is significantly better than almost all individual estimates. This result (the success of the average) tends to hold as long as each student arrives at an estimate by working alone and without the distraction of irrelevant information.
To implement our management ranking system, approximately every 18 months, we assemble a list of all U.S. micro- and small-cap companies held by Wasatch. We then determine which senior analysts and portfolio managers had “significant” contact with each company. Next, the senior analysts and portfolio managers receive an electronic questionnaire regarding their “significant” companies. Based on consistently applied criteria, each senior analyst and portfolio manager is required to rank each company’s management team subjectively. The rankings must be in numerical order (i.e., 1, 2, 3, 4, 5, 6, 7, etc.) with no ties.
We tabulate the management rankings from each senior analyst and portfolio manager. All the companies we hold are placed into quartiles based on the rankings. Over time, the data have shown that the first quartile has been our best factor-based indicator—and has outperformed the other quartiles and the broad market as a whole. We believe this performance profile is just one validation of our collaborative team approach to managing money.
Unlike crowd psychology in which crowd members are influenced by each other, the jelly bean experiment and our management ranking system harness the wisdom of crowds in which members form opinions without knowing the opinions of others. In this way, we truly get multiple perspectives—what we call “multiple eyes”—on each of our companies.
Quantitative Tools: Continual Learning, Performance Optimization And Risk Management
In closing, we’d like to touch on our quantitative tools. When many clients hear the word “quantitative,” they immediately think of computers and software being used to pick stocks. However, when we use the word “quantitative,” we want clients to think of continual learning, performance optimization and risk management.
Early in Wasatch’s history, we’d typically manage money with the following portfolio-positioning tactics. First, we’d often buy very small stock positions initially and then watch them for a while. Second, we’d frequently sell positions after a big gain. Third, we’d maintain significant cash weightings because we thought that would put us in a better position to buy attractively priced shares on market dips. Each of those tactics seemed to make intuitive sense. But the only way to know if they really made sense was to look at them quantitatively.
As a team that takes pride in continual learning, we ran the numbers and discovered that we’d been making tactical mistakes. So we changed our behavior in the right direction. Now, we generally wait to buy a stock until we have the conviction to take a meaningful position size. We’re also more likely to hold onto our winners for longer periods of time. And we keep smaller cash weightings because cash is typically a drag on performance and isn’t actually necessary for buying shares quickly.
At Wasatch, we want stock picking to drive our investment performance “alpha.” Our quantitative tools don’t tell us what to buy or sell. Instead, these tools help us size positions appropriately for performance optimization. Factors that go into position sizing are the aforementioned management rankings, quality metrics, valuation levels, momentum indicators, individual stock volatility and position correlations. Final sizing decisions are still made by portfolio managers, but we have a more powerful and repeatable process with the support of our quantitative tools.
It’s not always clear what risks are embedded in a portfolio. This can be especially true when performance is excellent. And frankly, overall portfolio risk evaluation is almost impossible without quantitative tools. At Wasatch, we track hundreds of style factors, group exposures and risk proxies. Perhaps the most important point we can make about risk management is to repeat a quote often attributed to Mark Twain: “It ain’t what you don’t know that gets you into trouble. It’s what you know for sure that just ain’t so.”
Finally, we note that our quantitative tools—like other aspects of portfolio management—are always evolving. Sam Stewart and his early partners established Wasatch’s basic principles. But we continue to refine and add to them.
J.B. Taylor is a portfolio manager, director and CEO of Wasatch Advisors. Mick Rasmussen, CFA, is a portfolio manager of Wasatch Global Advisors.
Risks and Disclosures
Information in this document regarding market or economic trends, or the factors influencing historical or future performance, reflects the opinions of management as of the date of this document. These statements should not be relied upon for any other purpose. Past performance is no guarantee of future results, and there is no guarantee that the market forecasts discussed will be realized.
As of March 31, 2024, no Wasatch strategy was invested in the securities mentioned in the preceding material. References to individual companies should not be construed as recommendations to buy or sell shares in those companies.
Wasatch Advisors LP, trading as Wasatch Global Investors, ARBN 605 031 909, is regulated by the U.S. Securities and Exchange Commission under U.S. laws which differ from Australian laws. Wasatch Global Investors is exempt from the requirement to hold an Australian financial services licence in accordance with class order 03/1100 in respect of the provision of financial services to wholesale clients in Australia. CFA® is a registered trademark of the CFA Institute.
Definitions
The Russell 2000 Index is an unmanaged total return index of the smallest 2,000 companies in the Russell 3000 Index, as ranked by total market capitalization. The Russell 2000 is widely used in the industry to measure the performance of small company stocks.
The Russell 2000 Growth Index measures the performance of Russell 2000 Index companies with higher price-to-book ratios and higher forecasted growth values. The Russell 2000 Index is an unmanaged total return index of the smallest 2,000 companies in the Russell 3000 Index. The Russell 3000 Index measures the performance of the largest 3,000 U.S. companies.
Indexes are unmanaged. Investors cannot invest in these or any indexes.
The Wasatch strategies have been developed solely by Wasatch Global Investors. The Wasatch strategies are not in any way connected to or sponsored, endorsed, sold, or promoted by the London Stock Exchange Group PLC and its group undertakings (collectively, the “LSE Group”). FTSE Russell is a trading name of certain of the LSE Group companies.
All rights in the Russell indexes vest in the relevant LSE Group company, which owns these indexes. Russell® is a trademark of the relevant LSE Group company and is used by any other LSE Group company under license.
These indexes are calculated by or on behalf of FTSE International Limited or its affiliate, agent or partner. The LSE Group does not accept any liability whatsoever to any person arising out of (a) the use of, reliance on or any error in these indexes or (b) investment in or operation of the Wasatch strategies or the suitability of these indexes for the purpose to which they are being put by Wasatch Global Investors.
© Wasatch Global Investors
Wasatch Funds are distributed by ALPS Distributors, Inc. Separately managed accounts and related investment advisory services are provided by Wasatch Global Investors, a federally registered investment advisor. ALPS Distributors, Inc., is not affiliated with Wasatch Global Investors.


