

Have you ever been asked to pick the one thing you would want to have if you were stranded on a desert island? I suspect you might consider items like water, food, a flare gun, or a boat.
Let’s consider a similar question for the financial services industry: What is the one fact you would like to know when making investment decisions for your clients? Answers might come from a myriad of macro or microeconomic factors including gross national profit, Fed activity, corporate profits or interest rates. For me the answer is easy … inflation!
In addition to threatening the purchasing power of our clients over time, inflation can also significantly impact the price movement of equities and fixed-income securities. This article explains how the rate of inflation may change the demands of investors for financial securities, which affects the price movement of stocks and bonds.
Equities
As advisors, we know that the price-earnings ratio is a measure that expresses how investors value a stock. The PE multiple that investors are willing to pay for a company’s earnings can vary depending on a myriad of company, industry and economic factors. So why is inflation important?
A plot of market data demonstrates that PE multiple investors are willing to pay for corporate earnings generally move in the opposite direction of changes in the rate of inflation. The chart below shows the relationship between inflation and PE ratios for the past 30+ years. Specifically, it plots the annual change in the rate of inflation (blue line) using the Consumer Price Index for All Urban Consumers and the PE ratio of the S&P 500 (red line) based on trailing earnings. Values for the horizontal axis (percentages) and vertical axis (time) were removed to highlight the movement and not the magnitude of the two lines.
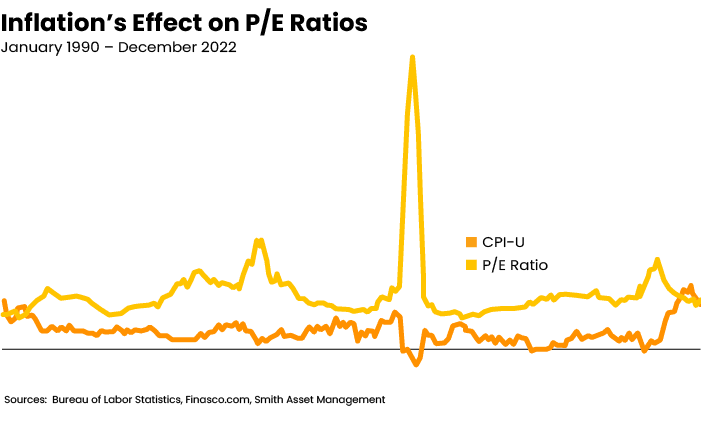
You will notice that upward movement in the blue line (inflation) is generally accompanied by a decline in the red line (PE ratio). Similarly, downward movement in the inflation usually results in an increase in the PE ratio. Movement in the PE ratio, regardless of changes in corporate earnings, can significantly affect equity prices. The chart provides visible support for a proprietary statistical analysis I conducted of inflation and PE data. That analysis showed a meaningful inverse relationship between the two measures.
Sadly, that relationship occurred this past year. You may recall that the rate of inflation soared to a 40-year high and was accompanied by falling PE ratios. As a result, stock prices experiencing a bear market in which the Standard & Poor’s index declined more than 25%.
This relationship demonstrates the reluctance of investors to pay for corporate earnings that are derived from price increases instead of favorable trends in a company’s operations. In addition, higher inflation often leads to higher yields being available from fixed income securities, making bonds relatively more attractive in comparison to stocks.
Fixed-Income Securities
Yields and prices of fixed income securities may be affected by artificial factors, such as Federal Reserve manipulation, although their longer-term trends reflect changes in the annual rate of inflation. Specifically, inflation and interest rates generally move in the same direction while inflation and bond prices move in the opposite direction.
The chart below plots the annual change over the past 30+ years in the rate of inflation (blue line) using the Consumer Price Index and the yield offered by bonds using a U.S. Treasury security that matures in five years (red line). Again, values for the horizontal axis (percentages) and vertical axis (time) were removed to emphasize the movement, not the magnitude, of the two lines.
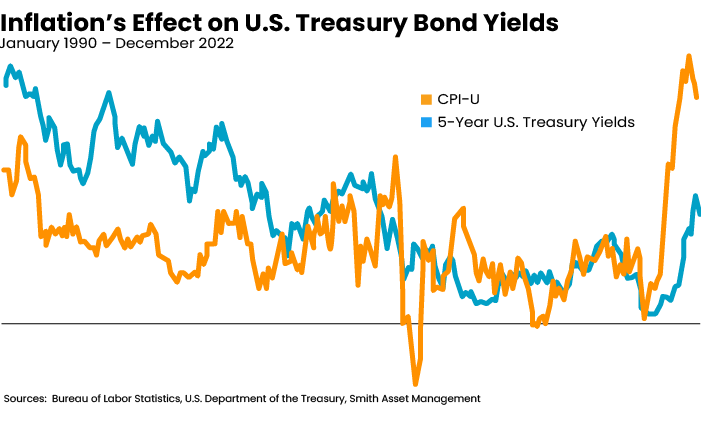
The graph shows that five-year U.S. Treasury bond yields moved in a similar direction as inflation over the long- and short term. Specifically, the rate of inflation and five-year U.S. Treasury yields both declined in a saw-toothed pattern for most of the period shown in the chart. Similarly, the rate of inflation reversed course during the past two years and rose rapidly to a 40-year high. As a result, investors demanded higher bond yields and interest rates, which decreased existing bond prices. It is worth noting that charts using one-, five- and 10-year U.S. Treasury yields show a similar relationship between inflation and yields. For example, high inflation during 2022 was accompanied by more than a 13% decline in the share price of the Vanguard Total Bond Market Index fund.
Additional Reading: Question Everything
Summary
Changes in the rate of inflation can affect the perception investors have toward equity and fixed income securities. An increase in inflation may cause stock and bond prices to fall while a decline in inflation can result in increases in their market values. Given the inverse relationship between the rate of inflation and the market value of equity and fixed income securities, consider the outlook for inflation and the impact it may have on the investment portfolios of your clients.
Frank Smith, CFA, RICP, MBA, is fiercely proud of the personal and award winning investment advisory services he provides to clients who are retired, near retirement or building their wealth. Among his many accolades, Frank was named “Best Investment Advisory Service Provider-Northeast USA”, ”Five Star Wealth Manager”, and “Best Investment Firm in Bucks County.”


